
Do not even think of looking at the seasonal variation of plant defense compounds without measuring the leaf dry weight – the use of graphical vector analysis is useful just like the proper quantitation protocols
Proper quantitation methods are not enough – there is more
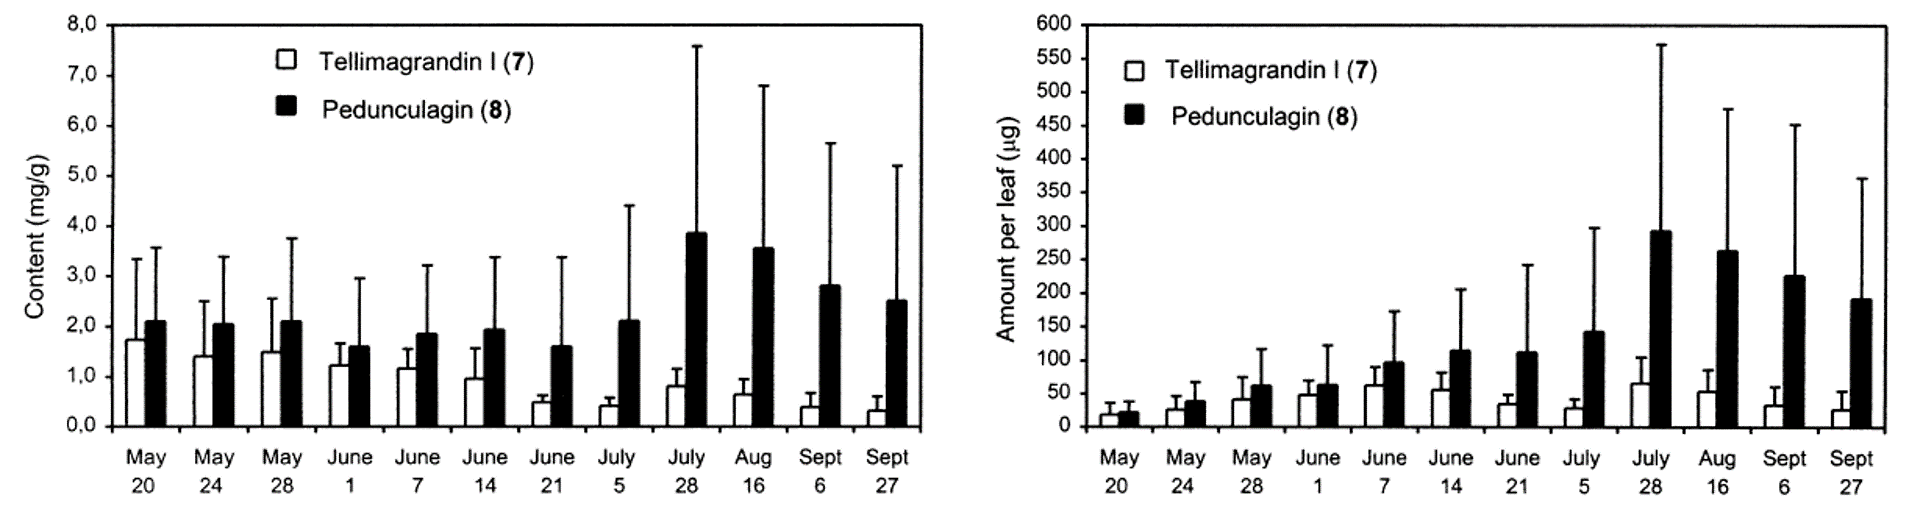
Figure 1. Seasonal variation of ellagitannins tellimagrandin I and pedunculagin in the foliage of Betula pubescens in mg/g DW (left) and in µg/leaf DW (right). It can be seen that between May 20 and June 14 both compounds lose their concentration in mg/g DW, but increase their amount per leaf over 3-fold. Thus they are effectively synthesised during this time period, altough that cannot be seen from the mg/g DW values as such. For more details of these and other hydrolysable tannins, please see Salminen et al. (2001).
There are a few issues to consider in detail before rushing into measuring seasonal variation of any plant metabolites. We are not talking of all the issues that need to be taken into account in quantitative studies, but additional issues specifically linked to studies on seasonal variation. See below for some examples.
Are you prepared to measure the dry weight of all leaves as well?
To understand seasonal variation and further biogenesis of the plant metabolites, it is most productive to measure concentrations of known compounds that have clear structural linkages to each other. Do you then want to draw conclusions, which of these compounds is actively synthesized and at which stage of the season? If yes, then you must weigh every single leaf you use in the quantitation for its dry weight. Why is that? It is simply no good quantifying mg/g DW concentrations in the growing leaf tissue without knowing the leaf dry weight, since otherwise one cannot make any conclusions about the rate of biosynthesis.
It is in general a very sensitive issue to make any conclusions of the rate of biosynthesis on the basis of foliar metabolite concentrations. However, sometimes people interpret constant mg/g DW concentration of foliar metabolites as a proof of constant biosynthesis, i.e. equal amount of the compound is produced as is used for the production of further biosynthetic products. In spring this conclusion could not be much worse! In rapidly growing leaf a constant mg/g DW concentration may mean that the mg/leaf content of the metabolite may be more than doubled in a couple of days. One should thus calculate the mass of the compound per one leaf, not the mg/g DW concentration only. Figure 1 shows examples of such cases where mg/g and µg/leaf values give fully different impressions of seasonal variation of hydrolysable tannins.
Consider using the graphical vector analysis – it is quite visual
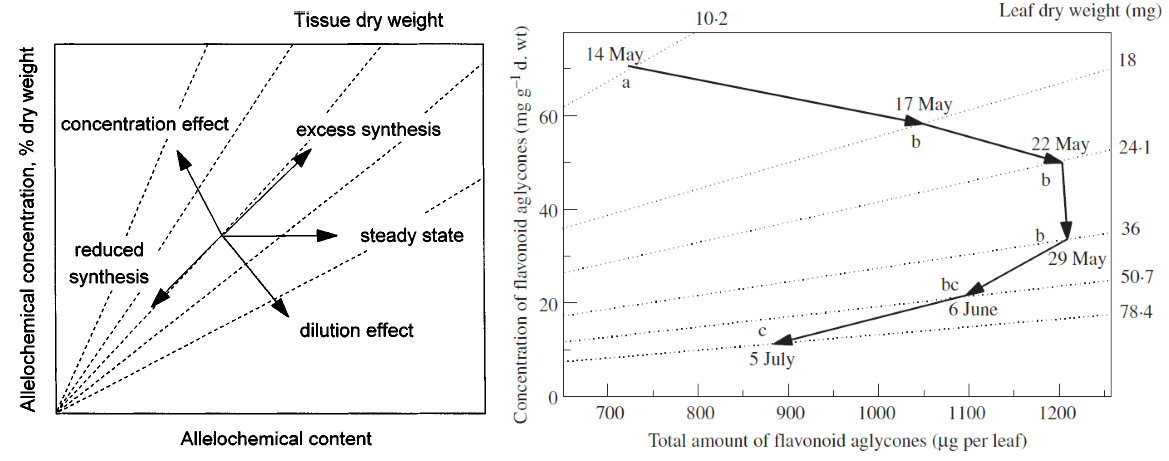
Figure 2. Graphical vector analysis combines the concentration of metabolites (y-axis) with their content (x-axis) to show visually how the state of metabolite synthesis seems to change as the season progresses. The figure on the left shows a model case where the directions of the arrows show the state of synthesis. The figure on the right shows an examples how Betula pubescens foliar flavonoid aglycones drop in concentration, but rise in content between the three first dates. That stage is called the dilution effect, since growing of the leaves is faster than the state of flavonoid synthesis. After 29 May the synthesis is then reduced as also the amount per leaf decreases. For more details, please see Koricheva (1999) and Valkama et al. (2004).
The above issue of increased vs. decreased biosynthesis rates can be revealed also by graphical vector analysis developed by Dr. Julia Koricheva in 1999. This analysis uses simultaneously both the foliar metabolite concentration in mg/g DW and the leaf dry weight to see how these change in time. This analysis reveals the stage of biosynthesis visually and is thus highly powerful to be used parallel with the figures shown above. Fig. 2 shows an example of graphical vector analysis.
“Do not dilute your knowledge – plants do it for you.”