
It is a nice idea to quantify tannins individually instead of measuring a less meaningful pool of total tannins, but to convince people to move from ideas to action requires that we create tools for the analysis of individual tannins
Can you use diode array detection to quantify individual compounds?
In very specific cases it may be possible to quantify individual tannins and other polyphenols by LC-DAD, i.e. liquid chromatography assisted by diode array detection. In these cases one must be sure that the peaks to be detected by DAD are chromatographically pure, i.e. only one compound elutes in one peak.
Most often plant extracts or any other kinds of extracts are complex enough not to allow DAD detection of the metabolites. We at the Natural Chemistry Research Group feel that the DAD approach can be used only if the LC gradient is well optimized and the peak purity is known. This is most easily achieved with a long UHPLC column and less easily with a short HPLC column. See the previous section Chromatographic methods and Figs 1 and 6 for examples how plant extracts are different in this respect and how wavelengths can bring selectivity to the analyses.
The use of mass spectrometers brings specificity to the quantitation
The specific MS analyses of polyphenols and other types of natural compounds can be achieved by many different ways, utilizing different types of MS techniques. The choice of the technique depends on the instruments available and also on the expertise of the operator. Naturally it may also depend on the available budget, since the prices of the MS instruments may vary over 10-fold, if for instance single quadrupole instruments are compared to Orbitrap instruments. One needs to also realize that it may be necessary to have separate instruments to qualitative and quantitative analyses, since the ultimate tool for quantitative mass spectrometry may not be the tool to be used for ultimate structure determination of natural compounds.
Even single quadrupole MS instruments can bring you a lot of joy
Chemists get easily carried away with the latest analysis techniques. That is fully understandable, since new and more sensitive and/or selective equipment enable us to achieve more accurate analysis of existing compounds or to do it from even lower concentrations or to detect such compounds not known to exist before. However, for the increased selectivity of quantification of known compounds in comparison to DAD detection, even the most simple single quadrupole mass spectrometers are enough.
With single quadrupoles or triple quadrupoles, the most simple quantification protocol can be achieved with the full scan analysis. The mass range used for scanning the ions depends on the molecular weights expected, but very rarely larger than m/z range of 100-1600 is needed, since e.g. compounds with the mass of 1568 Da will be most visible as ions at m/z 783. With polyphenols the MS should be operated in the negative ion mode, since it is typically much better for the ionisation of polyphenols than the positive ion mode.
Be careful with the full scan analyses – know what you quantify
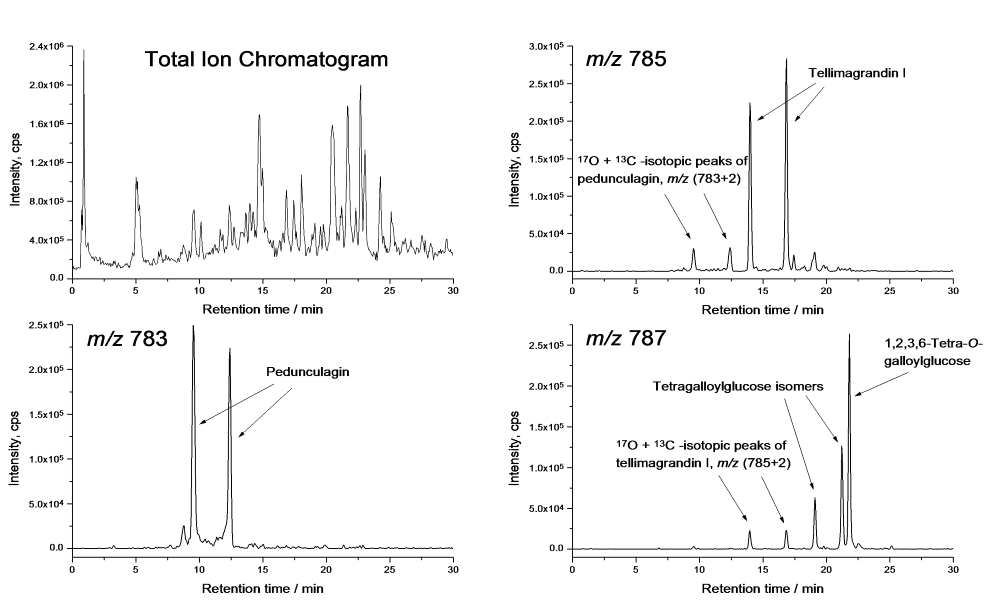
Figure 1. The total ion chromatogram and the specific m/z traces for tellimagrandin I, pedunculagin and three tetragalloylglucose isomers detected in the foliar extract of Betula pubescens by the method of Salminen et al. (2001).
Figure 1 shows how individual hydrolysable tannins can be quantified selectively with the negative ion full scan analysis. It also shows how this approach needs to be accompanied by some expertise in the results interpretation. This is mainly due to many different types of compounds giving the same m/z values with the mass spectrometer as e.g. tellimagrandin I, the m/z 785 in Figure 1. In these cases one needs to know which of the signals comes from the desired compound and which from artefacts. Such artefacts typically arise from the fragmentation of larger compounds, or as noted in Figure 1, from the isotopic peaks of compounds that have mass difference of –2 Da to the desired compound.
Better techniques allow more selective quantitation
Techniques such as multiple reaction monitoring (MRM) are the flagship quantitation techniques to be used with triple quadrupole mass spectrometers. They must be optimized compound-by-compound prior the quantitative analyses. If you analyse tens of compounds, this is of course lot of work for which you need to have expertise. For this reason the so-called metabolomics approaches are gaining popularity, since those can be used without almost any knowledge of the compounds to be analysed. All samples are analysed first and the compounds to be quantified are selected after the analyses. The more accurate is the mass spectrometer and the higher the resolution, the more reliable will be the compound identification. At this front both time-of-flight (TOF) and Orbitrap analyzers represent the most used techniques.
The use of multiple reaction monitoring techniques
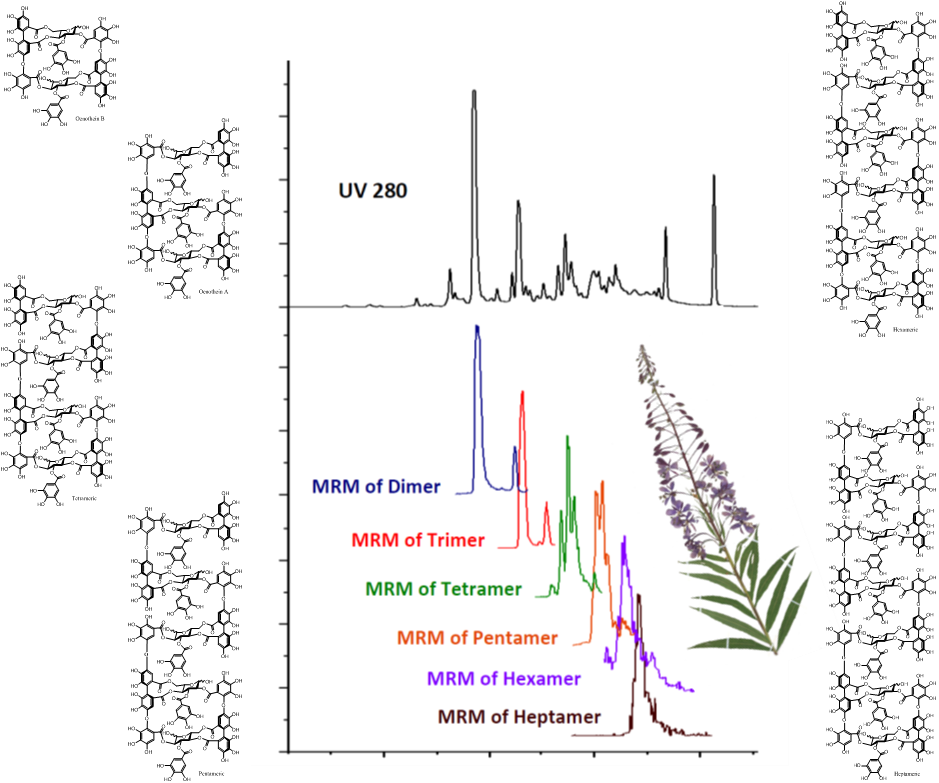
Figure 2. The UHPLC-DAD chromatogram of the foliar extract of Epilobium angustifolium (top) and the MRM chromatograms of the series of oligomers from dimer to heptamer (bottom) as achieved by the method of Baert et al. (2015). Of these compounds only the dimer and trimer could be reliably quantified from the DAD trace, since the other oligomers are either overlapped by other polyphenols or not detected at all by the DAD.
When the compounds of interest are limited in numbers and both sensitivity and selectivity want to be optimized, then the choice of MRM techniques by triple quadrupole mass spectrometers seem like an ideal choice. We at the Natural Chemistry Research Group utilize MRM techniques in specific cases where other options are less optimal. We give a couple of examples below.
First, we have found the largest ellagitannins in the plant kingdom. This was achieved by a combination of Sephadex LH-20 column chromatography and LC-TOF mass spectrometry. These compounds are found in plants in very low concentrations and TOF-MS was not good enough to detect the largest macrocyclic ellagitannin oligomers directly from the crude extract. For that reason we first purified those large oligomers individually and then optimized MRM quantitation techniques as presented in Baert et al. (2015). These methods now allow the direct detection and quantitation of macrocyclic tellimagrandin I –based oligomers from dimers to heptamers directly from a crude plant extract (see Fig. 2).
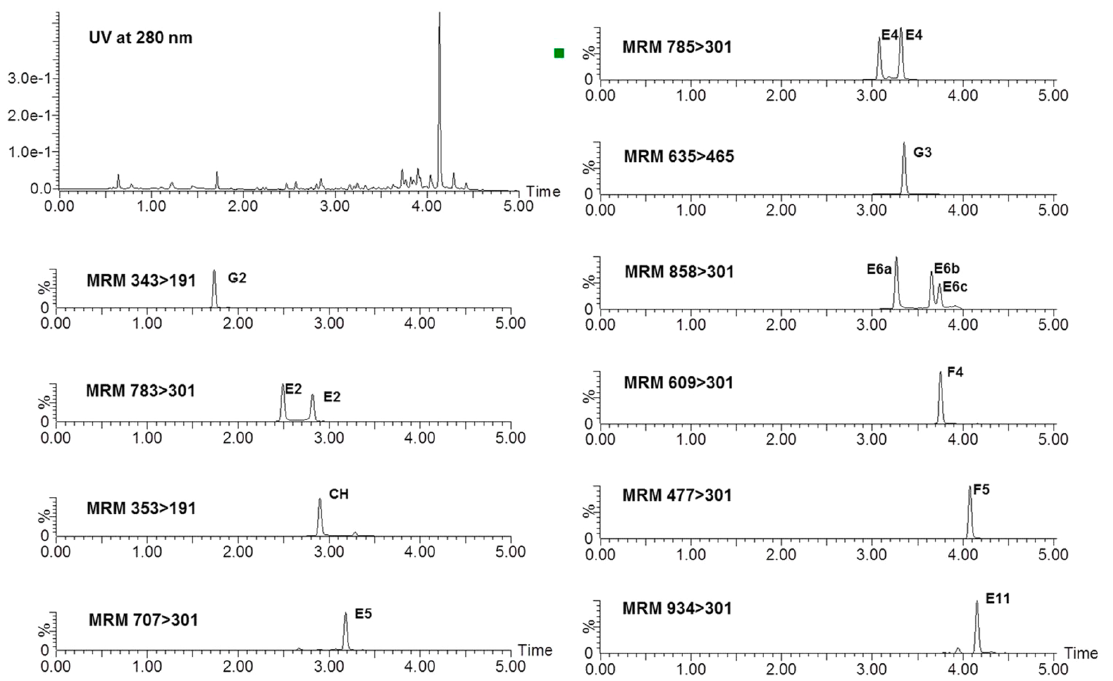
Figure 3. The UHPLC-DAD chromatogram of the foliar extract of strawberry leaves (top left) and the MRM traces of the selectively quantified individual polyphenols. See Kårlund et al. (2014) for the methods and details.
We have optimized and used MRM techniques also for polyphenols found in strawberry (Kårlund et al. 2014) and Geranium sylvaticum (Tuominen & Salminen 2017). These methods are efficient as the specific detection of the selected metabolites allows direct integration of the detected peaks followed by quantitation in mg/g DW. Figure 3 shows the strawberry example and how nicely MRM techniques pick up individual polyphenols from the UHPLC trace.
“Yes, I know individual tannins – tannic acid, for example.”