The types and numbers of phenolic functional groups in tannins determine much of the bioactivities of individual tannins and now these functional groups can be analysed selectively compound by compound
Traditional tannin methods have their limitations

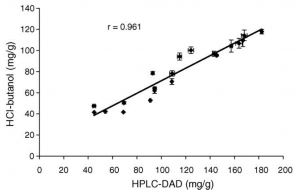
Figure 1. Concentrations of proanthocyanidins (in mg/g dry weight) measured from twenty dog rose hip extracts with the conventional HCl–butanol assay and the HPLC–DAD method developed in Salminen et al. 2005. The HCl-butanol assay tends to underestimate the results, especially at the high concentrations.
The more traditional types of tannin analyses rely on the quantitation of either tannin functional properties (e.g. protein precipitation capacity) or tannin functional groups. The latter may include quantitation of e.g. gallic acid by the rhodanine assay after hydrolysis of the original hydrolysable tannins, or anthocyanins by the HCl-BuOH assay after acid-catalyzed depolymerization reactions of the original proanthocyanidins.

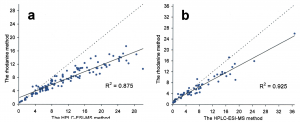
Figure 2. Contents of total galloylglucoses from 117 mountain birch samples (a), and 60 dwarf birch samples (b), measured both with the conventional rhodanine (gallic acid equivalents mg/g dry wt) and the HPLC–ESI-MS (sum of individual galloylglucoses mg/g dry wt) method developed by Salminen et al. (2001). The rhodanine assay tends to underestimate the results especially at the high concentrations. See Salminen (2003) for the details.
The two above mentioned methods have their merits, but are limited in their specificity and accuracy. They can be used to estimate the tannin types and amounts present in the plant extract, but too often these methods are used incorrectly. For instance, the rhodanine assay has been used to verify the presence of gallotannins in such plant species that do not synthesize any gallotannins, but ellagitannins instead. The HCl-BuOH assay should be quite safe to use, if replicate samples are analysed without the heating step in the oven; this hinders reporting false positives caused by possible anthocyanins present in the extract. According to our knowledge at the Natural Chemistry Research Group, these two methods tend to underestimate the true tannin content (Figs 1-2). Of course, they may overestimate it as well, especially if incorrect quantitation standards like the quebracho tannin are used (see e.g. Rautio et al. 2007).
Moreover, none of the so-called total methods reveal the specific tannins present in the plant extract, since they produce estimated data of the total functional groups only without knowing the actual tannins estimated. Thus, other methods are needed to reveal both all the tannin functional groups and the compounds responsible for these groups.
Modern methods offer more data of the tannin and flavonoid groups

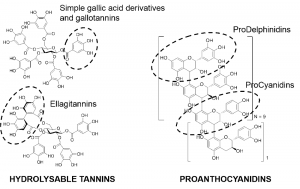
Figure 3. Example stuctures of hydrolysable tannins and proanthocyanidins: pentagalloylglucose (top left, monomeric galloylglucose, not yet gallotannin), tellimagrandin II (bottom left, monomeric ellagitannin) and 28-meric proanthocyanidin polymer with 18 prodelphinidin (PD) units and 10 procyanidin (PC) units (right). The group-specific MRM methods of Engström et al. (2014, 2015) detect the galloyl units found both in pentagalloylglucose and tellimagrandin II, the HHDP units found in tellimagrandin II, and PC and PD units found in the 28-meric proanthocyanidin. Examples of these groups are highlighted in the structures.
We at the Natural Chemistry Research Group have developed group-specific MRM methods for the detection of four most common functional groups of tannins: (1) galloyl groups that are present in simple gallic acid derivatives, gallotannins and even in many of the ellagitannins, (2) hexahydroxydiphenoyl (HHDP) groups present in many, but not necessarily all ellagitannins, (3) procyanidin groups present in the most typical proanthocyanidins, and (4) prodelphinidin groups present in the second most typical types of proanthocyanidins. Figure 3 shows examples of the tannin structures and the functional groups to be detected by these MRM methods.
In addition, our group-specific MRM methods can detect the three most common flavonoid groups: (1) quercetin derivatives, (2) kaempferol derivatives, and (3) myricetin derivatives. On the top of those, also quinic acid derivatives can be detected and this is convenient, since many phenolic conjugates are formed with quinic acid. Chlorogenic acids (caffeoyl quinic acids) are the most common examples of phenolic quinic acid derivatives.
One 10-minute analysis reveals seven of the tannin and flavonoid groups
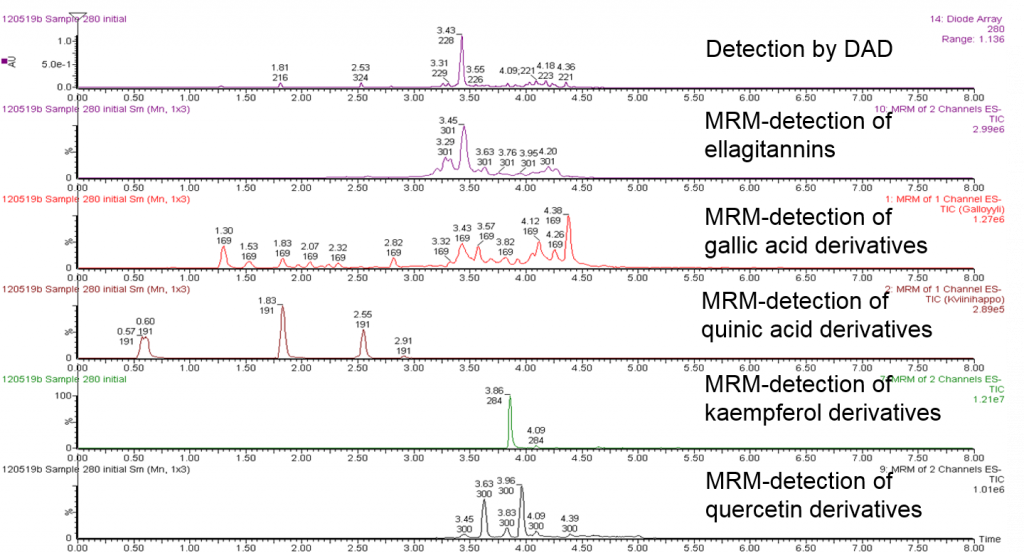
When these group-specific methods are applied to plant extracts, they automatically detect all the individual compounds that carry those specific functional groups in their structures. This allows several additional ways for utilizing the data. Figure 4 shows how the 10-minute analysis has revealed different types of polyphenols in the Geranium sylvaticum extract. For instance, the DAD chromatogram at the top shows all the compounds, but the group-specific data reveal which of the compounds carry galloyl and/or HHDP groups. Thus this data allows us to e.g. calculate how many galloyl derivatives were present in the extract. This would be practically impossible with any other technique.
When the above group-specific methods are accompanied by both UV spectra and full scan mass spectra of all major metabolites, the characterization of the detected compounds can be accelerated. Examples of these were shown in the Figure 5 of Engström et al. (2015). Thus this approach where one 10-min analysis produces all this data, may be one of the most powerful ways to produce accurate data of plant polyphenols rapidly and accurately. In cases where compound concentrations are low or the UV and MS spectra are not clear enough, more analyses are needed with other tools. But in general, this approach is the way to go at first and the most obvious polyphenol patterns can be revealed in a relatively short time.
“All tannins are the same, I have measured all of them by precipitation studies.”

Figure 4. UHPLC-DAD chromatogram of the foliar extract of Geranium sylvaticum (top) and group-specific MRM chromatograms for ellagitannins, gallic acid derivatives, quinic acid derivatives, kaempferol derivatives and quercetin derivatives, all detected at the same time from the same run. The group-specific analyses reveal automatically over 40 polyphenols and determine their polyphenol group at the same time. UV and MS spectra were also recorded during the run, enabling the characterization of individual compound with even higher accuracy.
