
Plants complicate the tasks of phytochemists by synthesizing hundreds of defense compounds in the plant cell and for that reason chromatographic methods are needed to yield less of a mess into the quantitative detector
Why would you even try to analyse compounds individually?
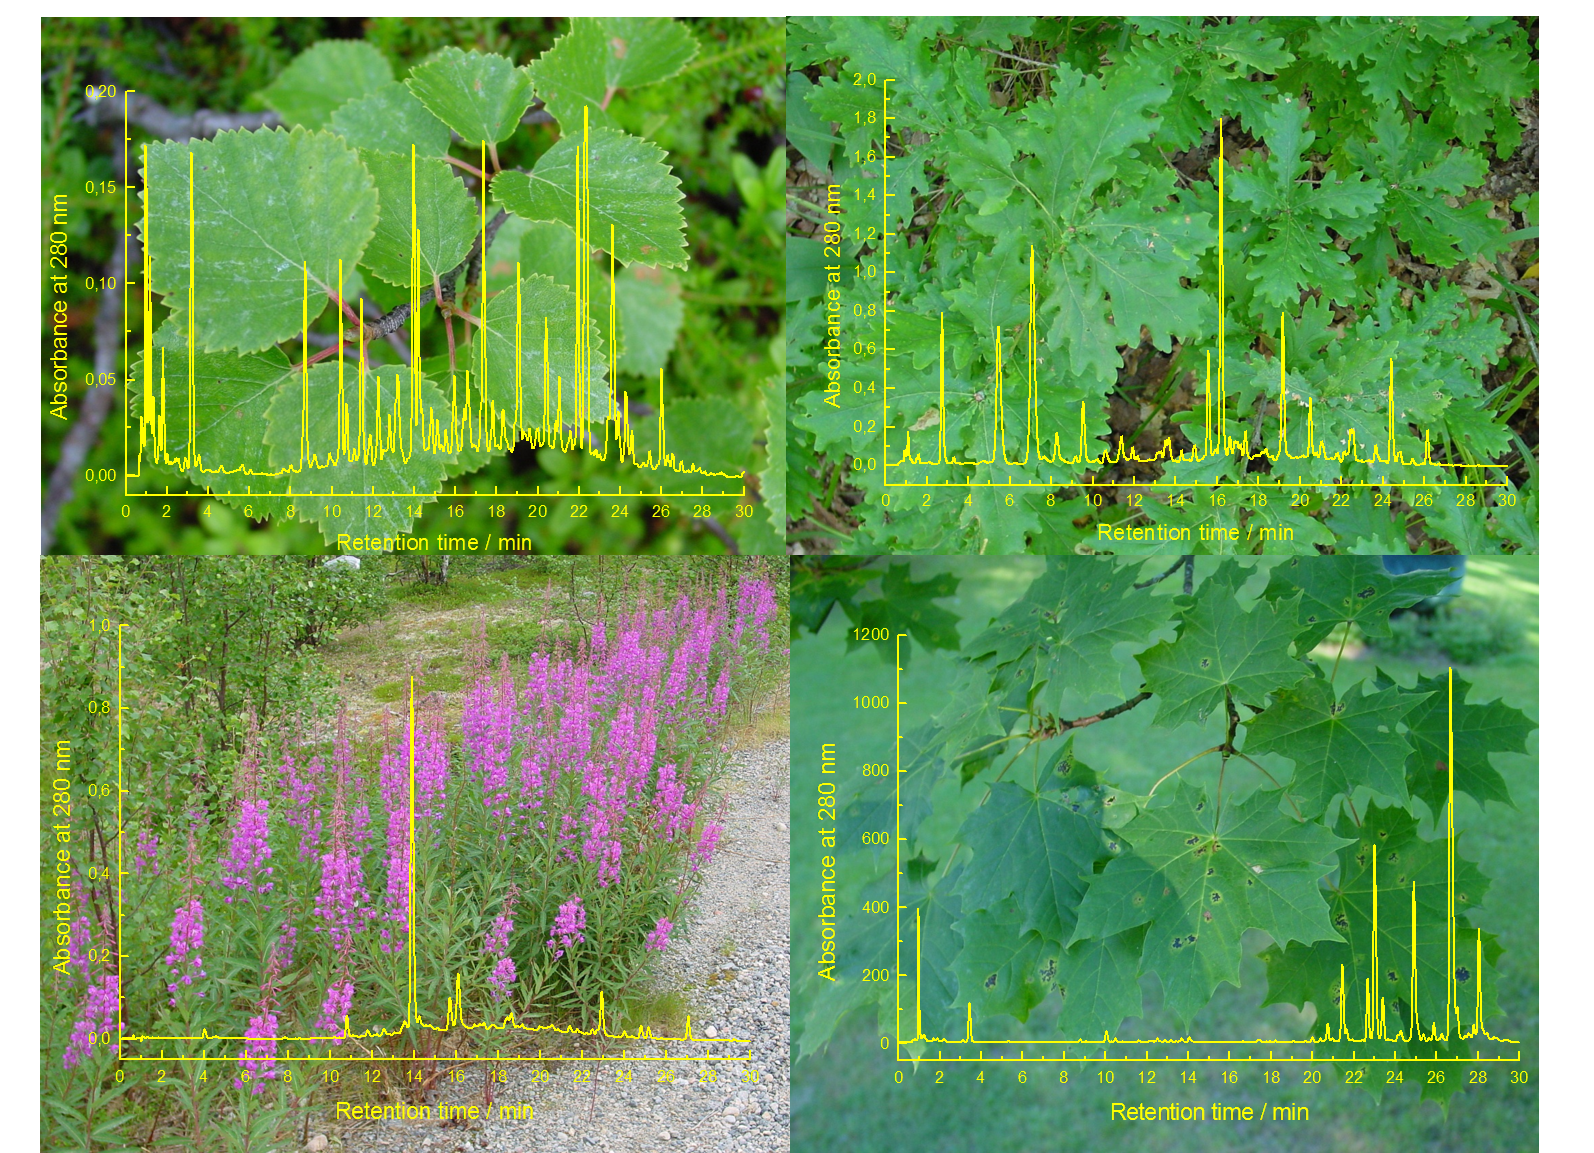
Figure 1. The HPLC-DAD chromatograms of foliar extracts of Betula pubescens (top left), Quercus robur (top right), Epilobium angustifolium (bottom left) and Acer platanoides (bottom right) recorded with the methods reported by Salminen et al. (1999). It appears that E. angustifolium and A. platanoides have simpler chromatographic phenolic profiles and that B. pubescens clearly has the most complex one. Complex chromatographic profiles mean that the risk of coelution and overlapping of peaks in the chromatograms is a true risk, making the quantitation of individual compounds less reliable by simple DAD detection.
It is quite easy to reach such a consensus that the biological activity of drugs and all natural compounds in general is derived from their specific structures. The drug development literature is full of examples how very tiny stereochemical differences in the structures may yield huge difference in the activity. We have similar examples available for the anti-herbivore activity of tannins, but even still, it seems difficult to convince all scientists to drop the analysis of for instance total phenolics. Luckily the wheel is turning for the better all the time as the field of chemical ecology is learning to appreciate accurate analyses over more rough estimations.
The analysis of individual compounds produced by the plant cell is not necessarily a trivial task. Much depends on the species in question and on the compound to be quantified. For some species-compound pairs quantitative protocols may be in fact quite easy to develop, while the same compound from another species might be much trickier to quantify selectively. The demanding part of the protocol relates to the specific equipment needed and for the ability to purify and identify the compound in question. Sometimes multidisciplinary collaboration is needed, if not all the time, but at least at the stage where the protocols are created for the first time.
High-performance liquid chromatography vs. ultra-performance liquid chromatography (HPLC vs. UPLC)
It is perhaps self-evident that all analysis platforms that aim to focus on individual compounds should contain a chromatographic separation step in front of the quantitative detector. Otherwise the quantitation of an individual compound within hundreds of compounds is simply impossible (Fig. 1). It is perhaps not that relevant, if the separation is achieved by HPLC or UPLC (also called UHPLC) technique. UPLC columns are available in 1.7 µm particle sizes, while HPLC particle sizes vary between 2.5-5.0 µm. The smaller the particle size, the more efficient chromatography is achieved, at least in theory. This relates to the higher number of consecutive interactions between the solid stationary phase and the liquid mobile phase achieved in UPLC columns due to them being packed more densely with the smaller chromatographic particles.
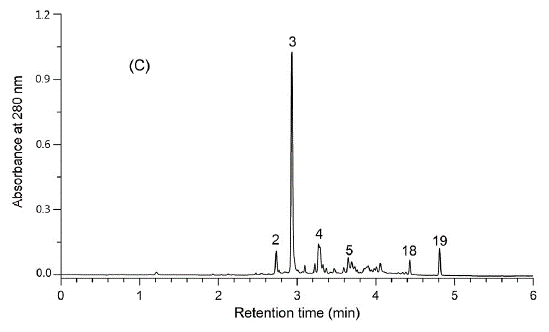
Figure 2. The UPLC-DAD chromatogram of the foliar extract of E. angustifolium as recorded by the method of Baert et al. (2017). This analysis as a whole takes 8.5 minutes, while the analysis type of Fig. 2 took 45 minutes (including column wash and stabilisation). The UHPLC approach took 4.25 ml of analysis solvents, while the HPLC approach of Fig. 1 took 45 ml of analysis solvents. In addition to saving 81% in time and 91% in solvents, the UHPLC approach produced better chromatographic resolution for the polyphenols detected.
Particle size affects also the backpressure produced by the column and sometimes HPLC instruments simply are not able to handle such high pressure caused by particle sizes lower than 5 µm. UHPLC instruments are also slightly more expensive than HPLC equipment. As often in chemistry, it is the budget that dictates the level of equipment that dictates the level of the analyses. However, very nice results can be achieved by both techniques, the main advantage of UHPLC being much faster analysis times and dramatically lower consumption of LC solvents. Of course the lower solvent flow rates may be more compatible with the mass spectrometry detectors as well.
Choosing the LC column
Once the LC instrument is chosen, one needs to choose between many different types of HPLC or UHPLC columns. Shortly, reversed-phase LC (RP-LC) columns should be superior for natural compounds over the normal-phase columns, but e.g. alternative LC phase such as HILIC (hydrophilic interaction liquid chromatography) may be suitable for some specific needs. The traditional C18-columns are still good ways to start RP-LC analyses, but other column chemistries are increasingly available so that the fine-tuning of the column chemistry and compound separation is definitely possible. Finally, the longer the column, the better the separation, at least in theory. The main advantages of shorter columns are faster analysis times, and faster washing and stabilization periods between the quantitative runs. What you gain in chromatographic separation, you lose in time, and vice versa. Fig. 2 shows one example, not yet an extreme one, how more than 80% of analysis time and solvents may be saved and chromatography gets even better.
The development of the LC elution gradient
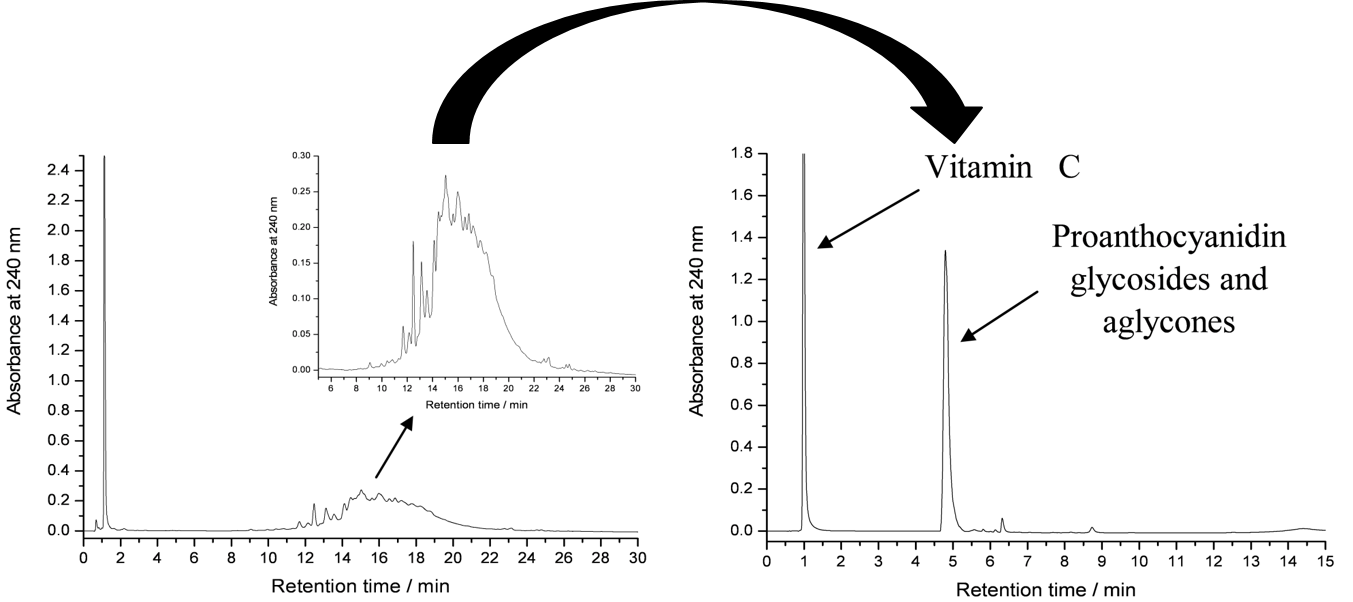
Figure 3. The normal and accelerated HPLC-DAD chromatograms of rose hip extracts as analysed in Salminen et al. (2005). The chromatogram on the left is run by first eluting vitamin C with 100% 50 mM H3PO4 for 3 minutes and the accelerating the acetonitrile percentage from 0% to 30% within 30 minutes. The chromatogram on the right shows a specific case example that was only possible to do with rose hip samples, i.e. to first elute vitamin C with 100% 50 mM H3PO4 for 2.5 minutes and the accelerating the acetonitrile % from 0% to 70% between 2.5 and 3.5 minutes. Keeping acetonitrile constant at 70% until 6 minutes allowed the rapid elution of all proanthocyanidin aglycones and glycosides as a sharp peak (right) instead of a poorly resolved hump (left).
Once the column is chosen, one must decide the eluents, flow rates and gradients used. That depends totally on the compounds to be analysed and the detection method to be used. Generally speaking, acidic water (e.g. 50 mM H3PO4 with DAD detection and 0.1% HCOOH with MS detection) will be a good starting eluent for most of the natural compounds, and certainly for polyphenols. If very polar and relatively small compounds are analysed, then the gradient should start with the acidified water only. A short isocratic step is used to let all the least retained compounds to achieve some separation in the column. Then the less polar eluent is introduced into the column (often acetonitrile or methanol) and the steepness of its gradient (i.e. % increase in time) will determine the time of analysis and the separation of the analytes. The steepness depends on the column size and flow rate used. Too steep gradient forces compounds to elute too rapidly and too lazy gradient makes peaks wide analysis too long. The best steepness is quite easily found with some tens of test runs with as complex sample as possible.
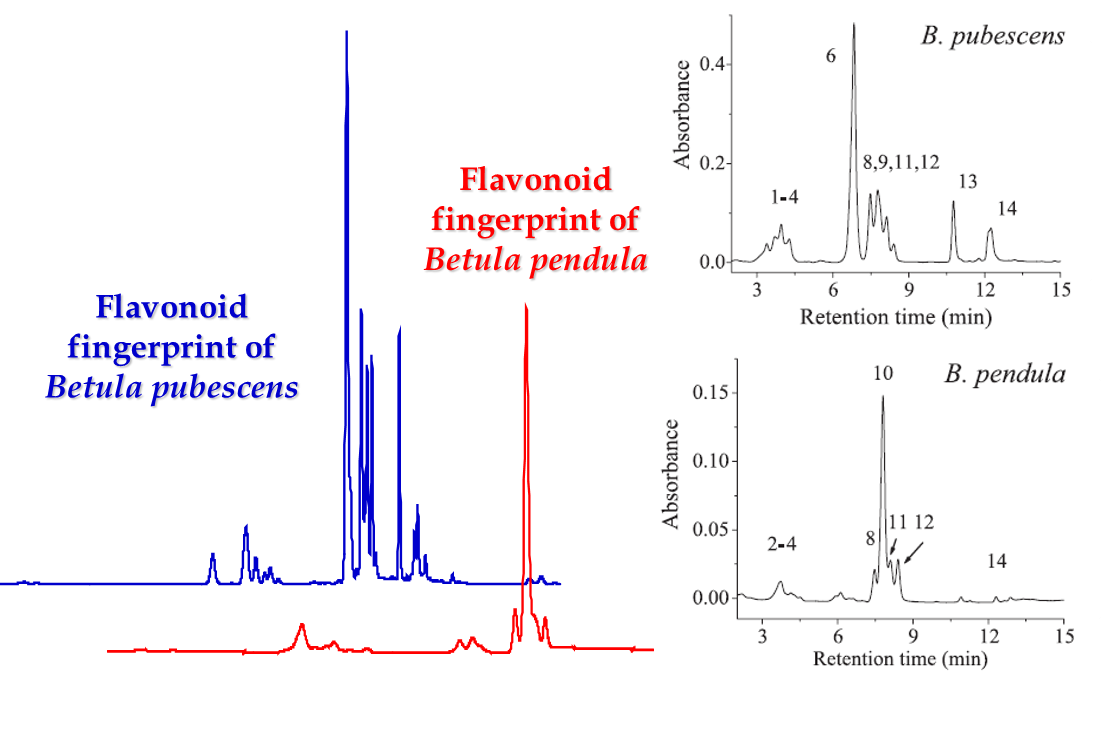
Figure 4. The fingerprints of lipophilic flavonoid aglycones that are produced onto the birch leaf surface by glandular trichomes. The blue and red chromatograms were acquired by the method of Valkama et al. (2003) where the acetonitrile gradient was really slow and the flavonoids eluted at 32-40 minutes. The chromatograms on the right were run by the Lahtinen et al. (2005) approach that used the same HPLC column, but much more rapid acetonitrile gradient starting at 30% acetonitrile, thus enabling the elution of lipopholic flavonoids within 15 minutes.
Typically 30% acetonitrile is enough to elute most of the polar metabolites, while 70-90% acetonitrile may be needed to elute the most lipophilic metabolites. For polyphenols this means that all analyses start at 0% ACN, stay there for a short period and then rise to 30% ACN within a given time. During this time most of the polar polyphenols are eluted from the column. Remember that methanol is weaker RP-LC eluent than acetonitrile, i.e. higher concentrations of methanol are needed to achieve the same elution profile of compounds as with acetonitrile.
If only lipophilic compounds are analysed, then the gradient should not be started with water, since it may precipitate the lipophilic compounds in the column. Thus the gradient must be started with a suitable acetonitrile percentage, suitable depending on the lipophilic nature of the analytes. For extreme lipophilics, 30% ACN may be a good starting solvent (Fig. 4). If that is used for polar polyphenols, all compounds are eluted without any chromatographic separation (see Fig. 3 for how the proanthocyanidin hump eluted as one sharp peak with “too strong” solvent).
The eluent composition and specific gradient steps need to be tested by several tests before the final approach can be selected. Each column must have its specific LC gradients and maybe even flow rates. The development of the LC gradient plays a crucial role, especially if individual compounds are to be quantified by diode array detection. With a lousy non-optimized gradient there is no hope to achieve good quantitative results with DAD detection. For MS detection the LC separation is not that important, although it should not be overlooked either.
Detection by UV vs diode array vs MS detector
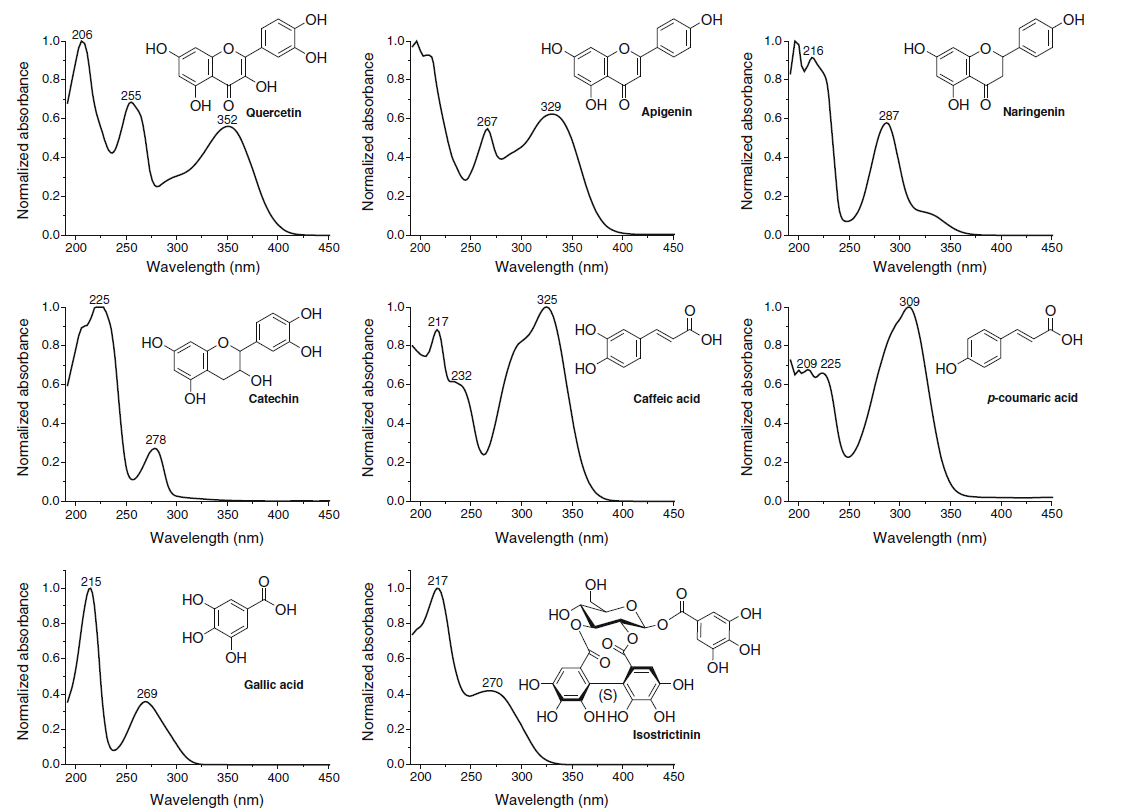
Figure 5. The UV spectra of different polyphenol types differ greatly from each other. They are really useful in categorizing compounds into certain polyphenol groups, but it can be alkso seen that all polyphenol types have UV absorbance at around 200 nm region. More specific wavelengths can be found e.g. at around 350 nm where three of the above polyphenol classes have no significant absorbance, but two of them have wavelength maxima at that specific area.
When natural compounds are analysed by LC instruments, you have practically two types of detector options and simple UV detection is not one of them. Different types of compounds have very variable UV spectra and thus you can obtain specificity in the detection by choosing the detection wavelengths according to the analytes to be detected (Figs 5-6); this cannot be done with UV detector alone, unless you are willing to do multiple analyses of the same sample at different detection wavelengths.
In addition, it is very important to know what you actually measure and for that reason sole UV detection simply is not good enough. Even if you analyzed tens and hundreds of samples of the same plant species with the very best LC gradient, you will see samples where either co-elution of compounds or between-sample drifting of retention times makes it difficult to judge which compound is which. In these cases UV spectra of compounds help – but does not always enable – you to make the correct call, unless you want to achieve your final results accompanied by uncertain level of uncertainty.

Figure 6. The HPLC-DAD chromatograms acquired from a single run of Betula pubescens leaf extract with the method of Salminen et al. (1999). The differences obtained in the UV spectra of different polyphenol types can be used to bring about specificity into the HPLC-DAD analyses. The most typical wavelength for polyphenols is 280 nm that shows all the polyphenol types. 200 nm brings flavan-3-ols more visible, meaning that in the case of B. pubescens the polymeric proanthocyanidin hump is seen very well. 315 nm and 349 nm show caffeic and coumaric acid derivatives together with flavonols and flavones, but 349 nm is clearly better for the latter types of flavonoids.
In other words: diode array detector is the absolute minimum of your detector options. With that the detection wavelengths may be chosen even after the analyses are done and every peak can be accompanied by its characteristic UV spectrum (Figs 5-6). Please note that the UV spectra of compounds also depend on the LC eluent at the background so that formic acid will deteriorate the quality of the spectra between wavelength area of approximately 195-230 nm. Thus the quality of UV spectra at this region is always dependent on the relative concentration of formic acid vs. the analyte in the diode array detection cell. Such problems are not seen with the 50 mM H3PO4 as the acidic buffer and for that reason we prefer it instead of formic acid in all analyses where mass spectrometers have no role.
More specific detection of natural compounds can be naturally achieved by MS detection, if the compounds in question can be both ionized and the formed ions flown in the mass spectrometer until detected. MS detection and its optimization have multiple points to be considered and some of them are dealt in the other sections such as Analysis of individual tannins, and Analysis of tannin functional groups. In any way, also MS detection should be accompanied by DAD whenever possible.
“Just buy a column and read one paper – is there more to method development?”